|
EUROPEAN CETACEAN BYCATCH CAMPAIGN |
|
|
|
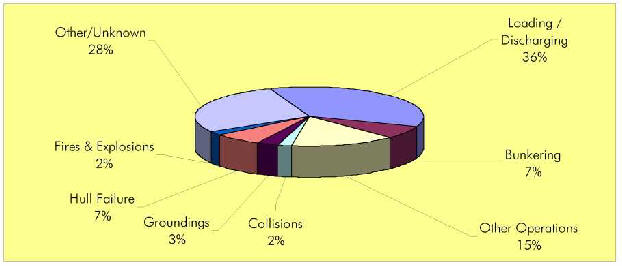
Incidence of spills - Tonnes by cause, 1974-2001 |
|
Figure 4: Incidence of spills less than 7 tonnes by cause, 1974-2001 |
|
|
|
|
|
|
|
|
|
|
|
|
|
|
|
|
|
|
|
|
|
|
|
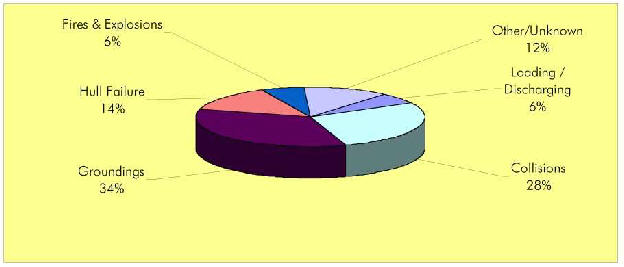
Figure 5: Incidence of spills 7-700 tonnes by cause, 1974-2001 |
|
|
|
|
|
|
|
|
|
|
|
|
|
|
|
|
|
|
|
|
|
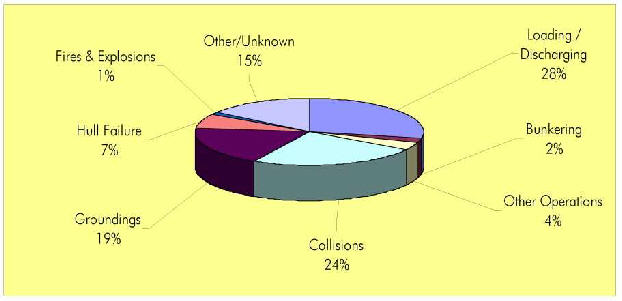
Figure 6: Incidence of spills greater than 700 tonnes by cause, 1974-2001 |
|
|
|
|
|
|
|
|
|
|
|
|
|
|
|
|
|
|
|
|