|
EUROPEAN CETACEAN BYCATCH CAMPAIGN |
|
|
|
MAJOR OIL SPILLS - HISTORICAL DATA |
|
Courtesy ITOPF (INTERNATIONAL TANKER OWNERS POLLUTION FEDERATION LIMITED) |
|
|
|
Major Oil Spills {ITOPF's Oil Spill Database Information Pack (pdf-685kb)} |
|
|
|
|
|
|
|
|
|
|
|
|
|
|
|
|
|
|
|
|
|
|
|
|
|
|
|
|
|
|
|
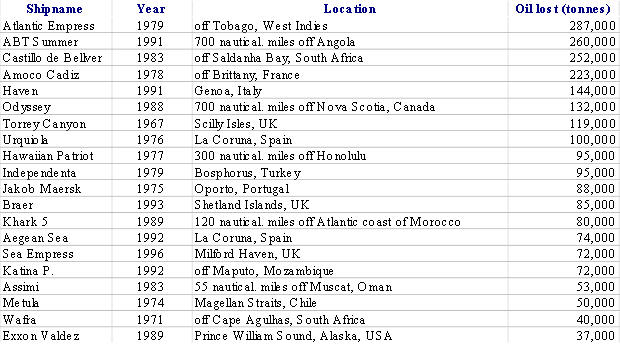
Table 3: Selected major oil spills |
|
(Click here to download the table shown above as an XlS file) |
|
|
|
|
|
|
|
|
|
|
|
|
|
|
|
|
|
|
|
|
|
|
|
|
|
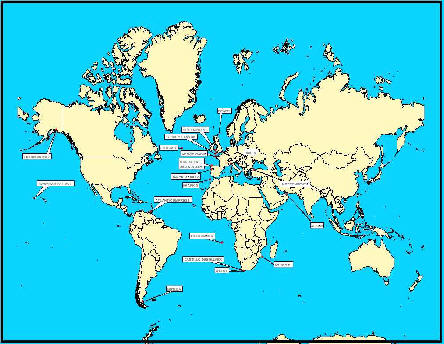
Figure 3: Location of Selected Spills |
|
|
|
|
|
Causes of spills |
|
|
|
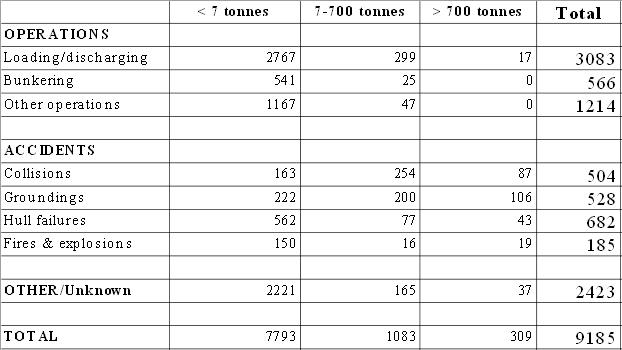
Most incidents are the result of a combination of actions and circumstances, all of which contribute in varying degrees to the final outcome. The following analysis explores the incidence of spills of different sizes in terms of the primary event or operation in progress at the time of the spill. These "causes" have been grouped into "Operations" and "Accidents". Spills for which the relevant information is not available or where the cause was not one of those given are listed under "Other". |
|
· most spills from tankers result from routine operations such as loading, discharging and bunkering which normally occur in ports or at oil terminals; |
|
· the majority of these operational spills are small, with some 92% involving quantities of less than 7 tonnes; |
|
· accidents involving collisions and groundings generally give rise to much larger spills, with a fifth involving quantities in excess of 700 tonnes. |
|
|
|
|
|
|
|
|
|
|
|
|
|
|
|
|
|
|
|
|
|
|
|
|
|
|
|
Table 4: Incidence of spills by cause, 1974-2001 |
|
(Click here to download the table shown above as an XlS file) |
|
|
|
|
|
|
